Machine-translated from Danish
Read the result
Purpose
Section titled “Purpose”Understand what the Overview page is, and where to find more detailed result views, both charts and tables.
Prerequisites
Section titled “Prerequisites”You’ve run a calculation.
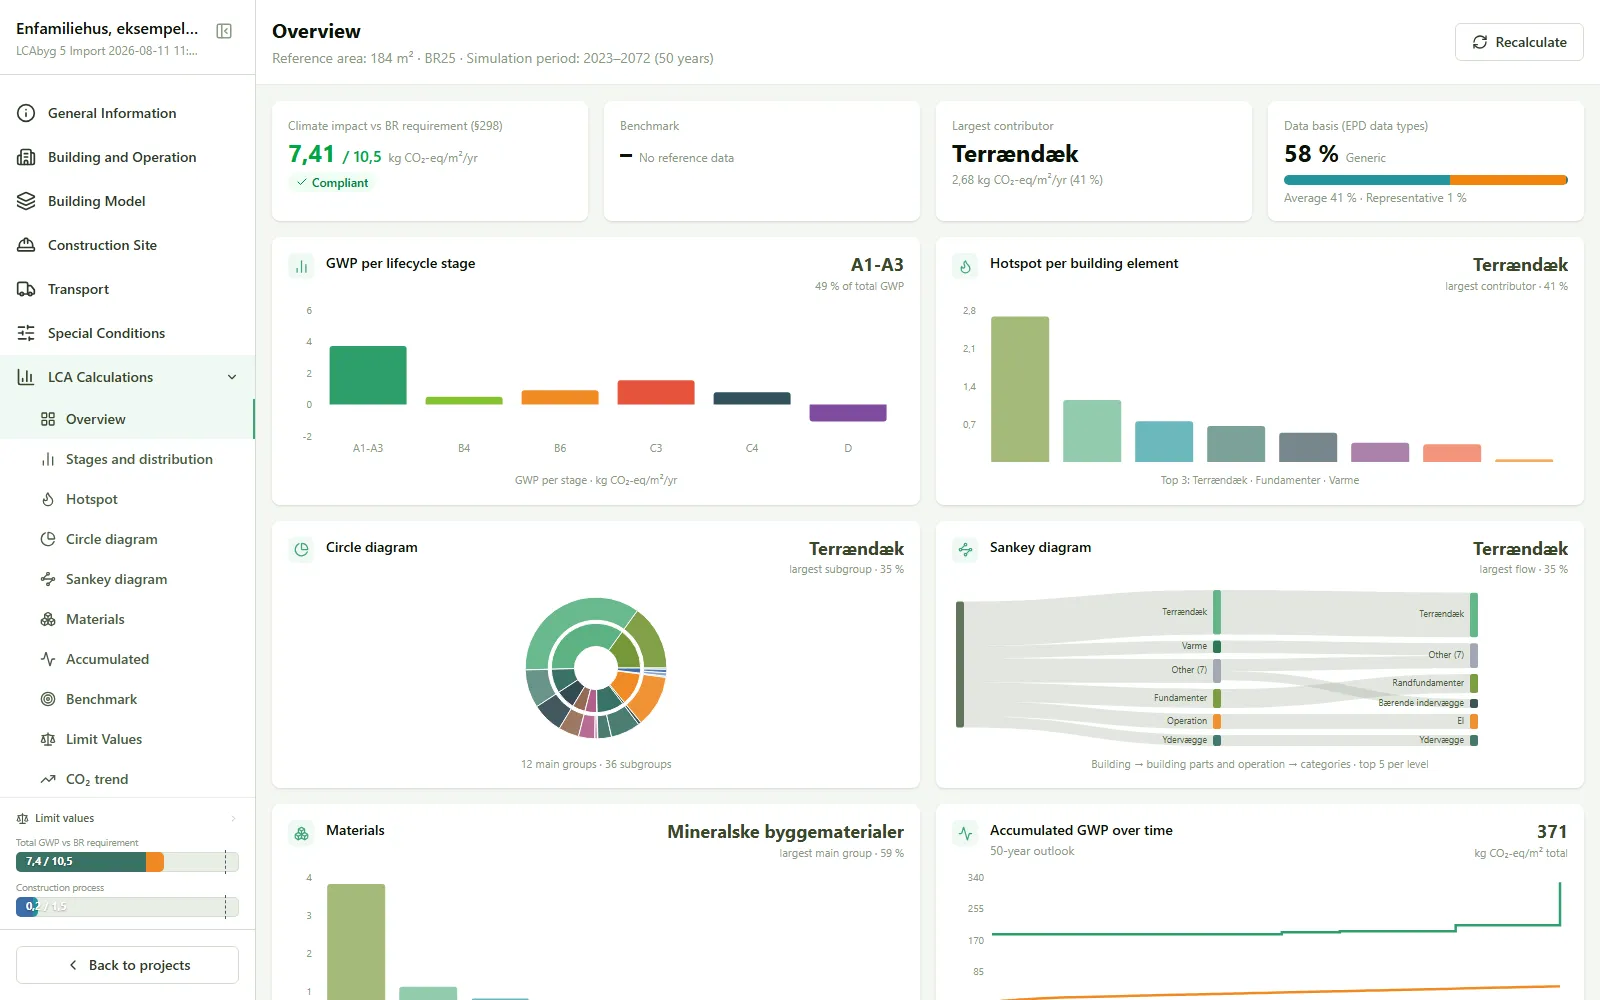
- Click LCA calculations → Overview in the project menu, if you’re not already there.
- See Climate impact vs. BR requirements (§298) at the top: the building’s total result in kg CO₂-eq/m²/year, and whether the project Passes or Exceeds the limit value for your building type.
- See Benchmark: how the project performs against comparable buildings.
- See Top contributor and Data basis (EPD data types): which building element contributes the most, and how much of the result is based on generic vs. specific data.
- Explore the other cards for further angles on the same result:
- GWP by life cycle stage: the result broken down by A1-A3, A4-A5, B4, B6, C3-C4, D and more.
- Hotspot by building element: which building elements contribute the most.
- Materials: the result broken down by material group.
- Sunburst chart and Sankey diagram: two other views of the same breakdown.
- Accumulated GWP over time: embodied vs. operational impact across the assessment period.
For a full table with every individual construction and building product, use the Result table instead of Overview.
Result
Section titled “Result”You can now read the project’s total result, see whether it passes the limit value, and find out which building elements contribute the most.